How to deploy Application Insights with alert-based Smart Detection using Terraform
I work as an Expert Distributed IIoT Software Solutions and have a passion for Azure, .NET and Angular.
Azure Monitor is one of the Azure services covering cross-cutting concerns that is responsible for collecting, analyzing and performing actions on telemetry data from various environments. Application Insights as a part of Azure Monitor provides extensible application performance management and monitoring for various types of applications.
One pillar of Application Insights is the Smart Detection mechanism that automatically warns about potential performance issues and failure anomalies. Due to the history of Azure, the feature has an own notification mechanism that is very limited. An exception to this has always been the failure anomalies detector which is part of alert management. Alert management as a part of Azure Monitor offers various configuration options like a granular definition of alert rules, the definition of action groups with specific notification mechanisms and the definition of alert processing rules.
Using a new preview feature the Smart Detection rules can now be integrated into the alert management of Azure Monitor. This guide shows how to automatically deploy Application Insights with alert-based Smart Detection using Terraform.
Overview to Azure Monitor Alerts
The alerts feature in Azure Monitor proactively notifies about critical conditions based on metrics or captured logs. The alerts management mainly consists of three pillars: Alert rules, Action groups and Alert processing rules:
Alert rules
An alert notifies about a violation of a condition of monitoring data. An alert rule specifies all relevant parameters required for monitoring like the condition or the action group that should be notified in case of violation.Action groups
An action group specified who should be notified with an alert and how notification should take place.Alert processing rules
These kinds of rules allow you to apply processing on raised alerts like applying filters, modifying action groups or suppressing notifications, among others.
Deeper insights and detailed information about the features of Azure Monitor can be found in the Microsoft Docs.
Terraform Deployment
Step 1: Create Application Insights
To get started with Terraform the respective providers have to be configured first. In our case, we are using the providers azurerm and azapi. The resulting part of providers.tf file can look like the following snippet. Things like authentication and state management are not covered by this guide. Please have a brief look at the Terraform docs when you are not familiar with configuring the azurerm provider.
terraform {
  required_version = ">=1.2.8"

  required_providers {
    azurerm = {
      source  = "hashicorp/azurerm"
      version = "~>3.20.0"
    }
    azapi = {
      source  = "azure/azapi"
      version = "~>0.5.0"
    }
  }
}
The provider azurerm is used to deploy the basic instances of the different resources. azapi provider is required since we will use features that are not covered by azurerm provider yet.
With the provider configuration available we can now write our Terraform blocks. We start with a Resource Group containing an Application Insights instance based on a Log Analytics Workspace.
Log Analytics is a part of Azure Monitor and provides functionality to store, retain and query collected data from monitored resources. A workspace is the logical storage unit where data is persisted. Log Analytics Workspace should be the preferred way how to create Application Insights since the classic mode is deprecated and will be retired on 29 February 2024.
All resources used in this step are available within the azurerm provider. The following snippet shows the Terraform configuration.
resource "azurerm_resource_group" "example" {
  name     = "rg-example-dev-we-001"
  location = "westeurope"
}

resource "azurerm_log_analytics_workspace" "example" {
  name                = "log-example-dev-we-001"
  location            = azurerm_resource_group.example.location
  resource_group_name = azurerm_resource_group.example.name
  sku                 = "PerGB2018"
}

resource "azurerm_application_insights" "example" {
  name                = "appi-example-dev-we-001"
  location            = azurerm_resource_group.example.location
  resource_group_name = azurerm_resource_group.example.name
  workspace_id        = azurerm_log_analytics_workspace.example.id
  application_type    = "web"
}
After executing the Terraform script the created resources within Azure look as shown in the following figures:
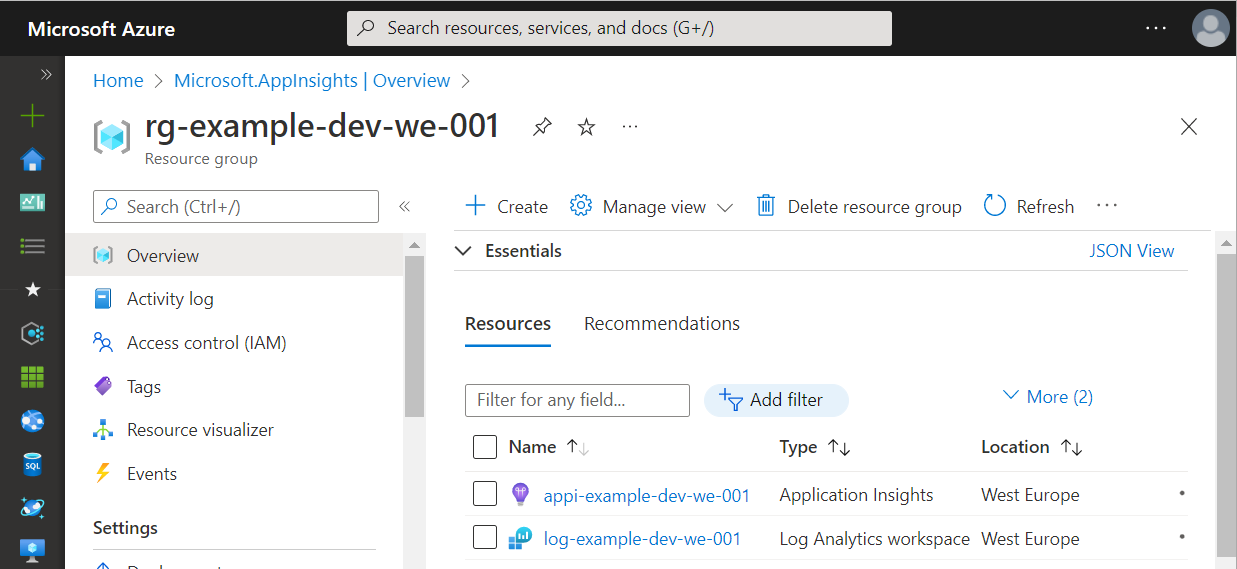
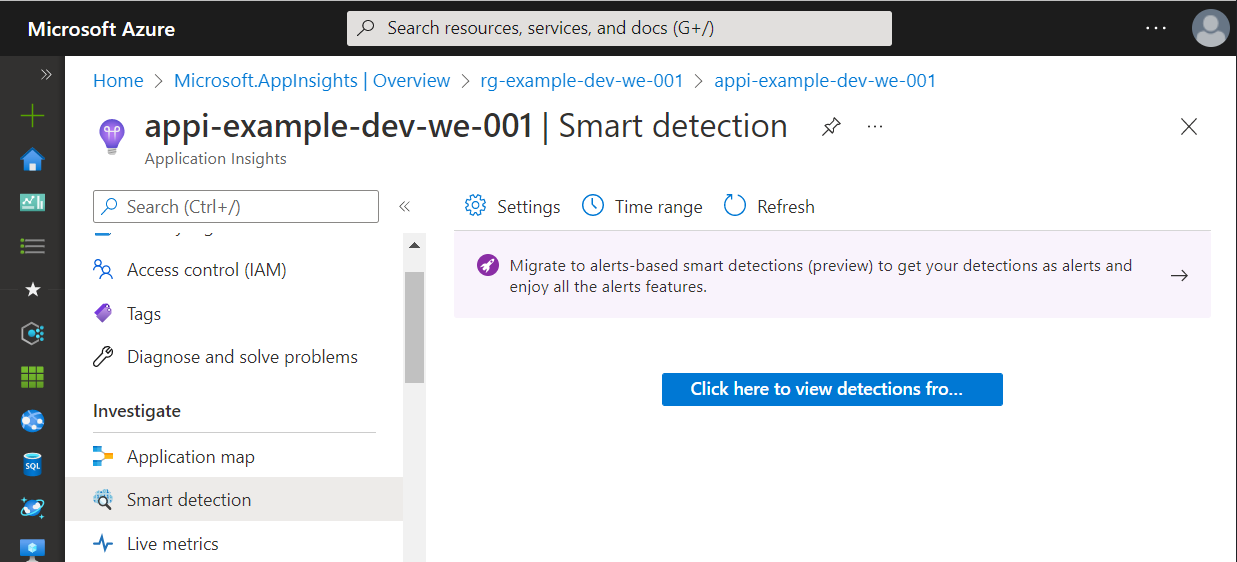
Within the Application Insights instance, Smart Detection is split into two views. The first one shows the raised alerts and a small hint concerning the new alert-based approach.
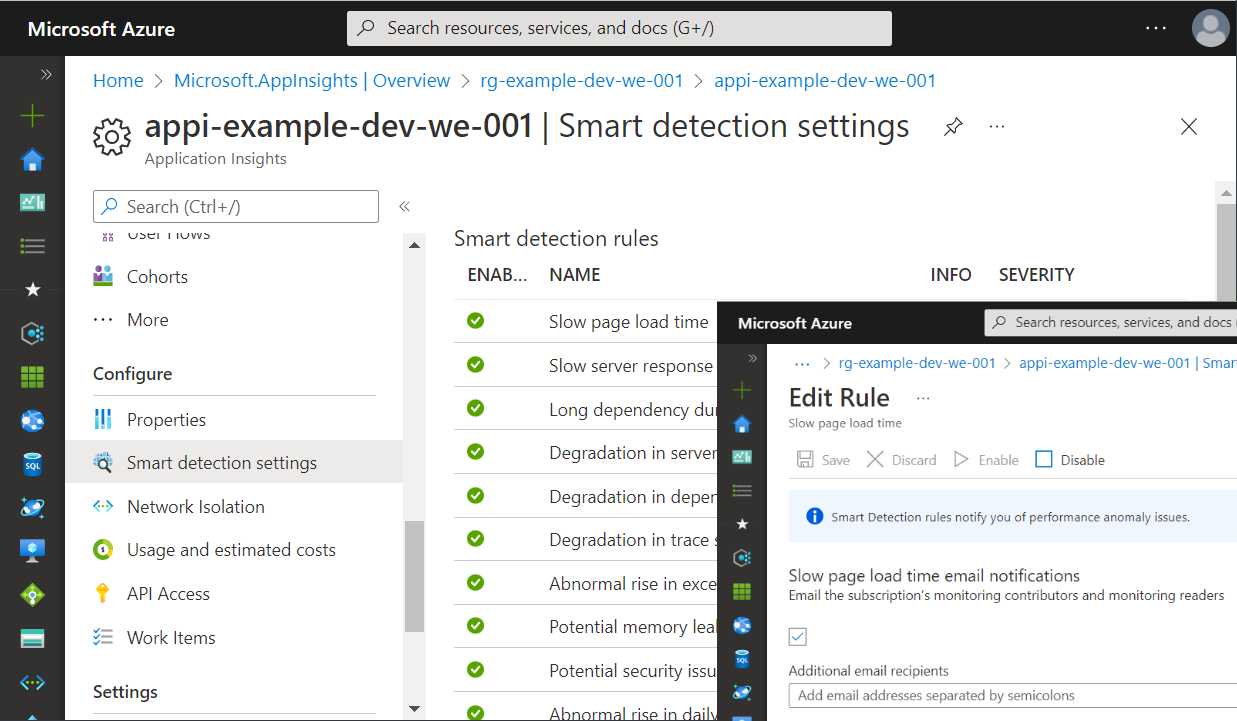
In the view concerning Smart Detection settings, all available rules are displayed. In the edit dialog, we can configure the notifications.
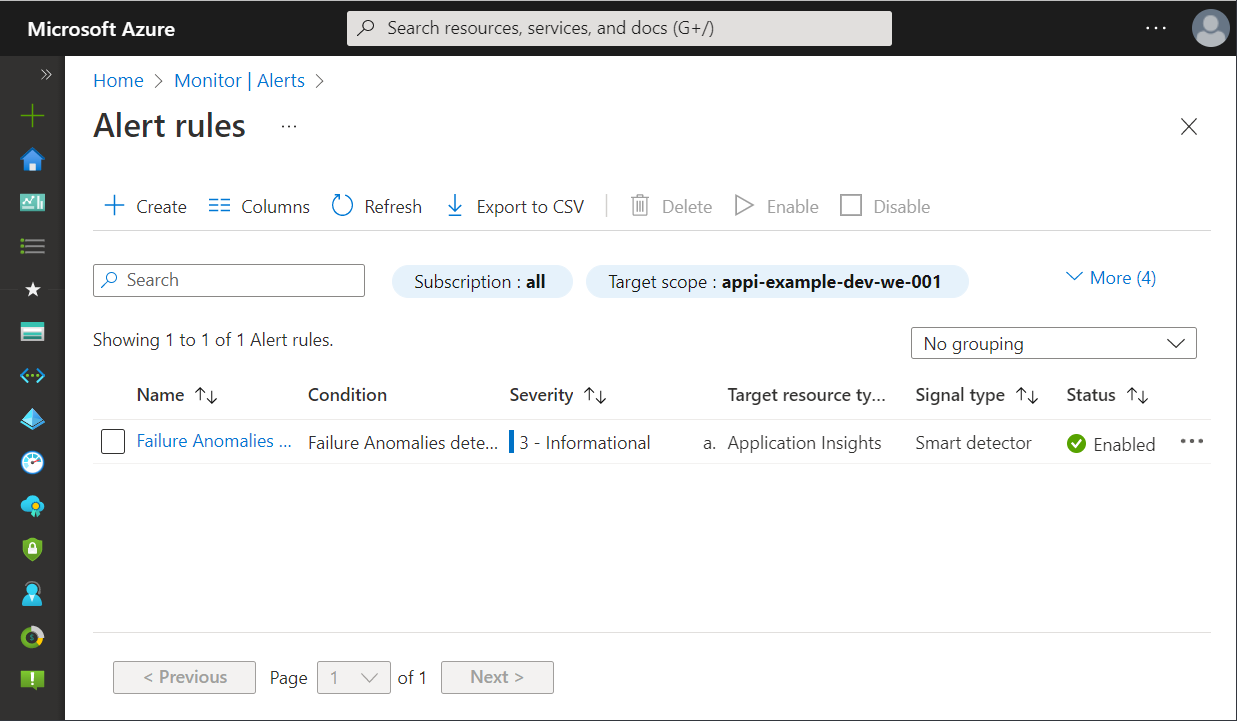
As mentioned above the failure anomalies rule has always been a special kind of Smart Detection. It is automatically created as an alert rule within Azure Monitor.
The current approach has several disadvantages:
- Smart Detection rules are created regardless of whether they are needed
- Smart Detection notification mechanism is limited and cannot be configured as it may be needed
- Creation of failure anomalies rule cannot be prevented and applied notification receivers are often the wrong persons
But there is also good news. With the new preview, many of these issues will be improved. The next sections cover these topics.
Step 2: Create and Configure Alerts
Deploy Action Groups
With Terraform an action group can be created using the azurerm_monitor_action_group block. The following snippet will create a new action group using mail receivers as one of many available possibilities like invoking an Azure Function, executing Logic App or running an Automation Runbook.
resource "azurerm_monitor_action_group" "example" {
  name                = "ag-example-dev-we-001"
  resource_group_name = azurerm_resource_group.example.name
  short_name          = "ag-example"

  dynamic "email_receiver" {
    for_each = [{ name = "receiver", mail = "receiver@example.com" }]

    content {
      name                    = "Send to (${lookup(email_receiver.value, "name", null)})"
      email_address           = lookup(email_receiver.value, "mail", null)
      use_common_alert_schema = true
    }
  }
}
With the snippet above you can easily add multiple receivers to the action group without repeating the email_receiver block. Therefore, we have to use a dynamic block due to the situation that for_each can only be used within specific block types.
Deploy Smart Detection Alert Rules
After specifying the action group we can now create the alert rules. In the case of Smart Detection rules the Terraform block azurerm_monitor_smart_detector_alert_rule must be used. For a metric alert, azurerm_monitor_metric_alert is the right choice. Since we are focusing on Application Insights and Smart Detection the snippet shows an example of how a Smart Detection alert rule can be created using Terraform.
resource "azurerm_monitor_smart_detector_alert_rule" "request_performance_degradation_detector" {
  name                = "Response Latency Degradation - ${azurerm_application_insights.example.name}"
  description         = "Notifies you of an unusual increase in latency in your app response to requests."
  resource_group_name = azurerm_resource_group.example.name
  severity            = "Sev3"
  scope_resource_ids  = [azurerm_application_insights.example.id]
  frequency           = "P1D"
  detector_type       = "RequestPerformanceDegradationDetector"
  enabled             = true

  action_group {
    ids = [azurerm_monitor_action_group.example.id]
  }
}
As you can see, the rule is scoped to the previously created application insights instance and notifies our action group. Via the field detector_type the Smart Detection rule can be selected. Right now the following detector types can be used:
- FailureAnomaliesDetector
- RequestPerformanceDegradationDetector,
- DependencyPerformanceDegradationDetector
- ExceptionVolumeChangedDetector
- TraceSeverityDetector
- MemoryLeakDetector
Step 3: Switch Smart Detection
We have almost managed to switch to the new alert bases Smart Detection mechanism. One last important step is still required. We have to tell Application Insights that the internal Smart Detection evaluation has been replaced with the detectors available within Azure Monitor alerts.
This step can be performed for example via the Azure Portal. It then implicitely enables the migrationToAlertRulesCompleted of resource type Microsoft.Insights/components/ProactiveDetectionConfigs.
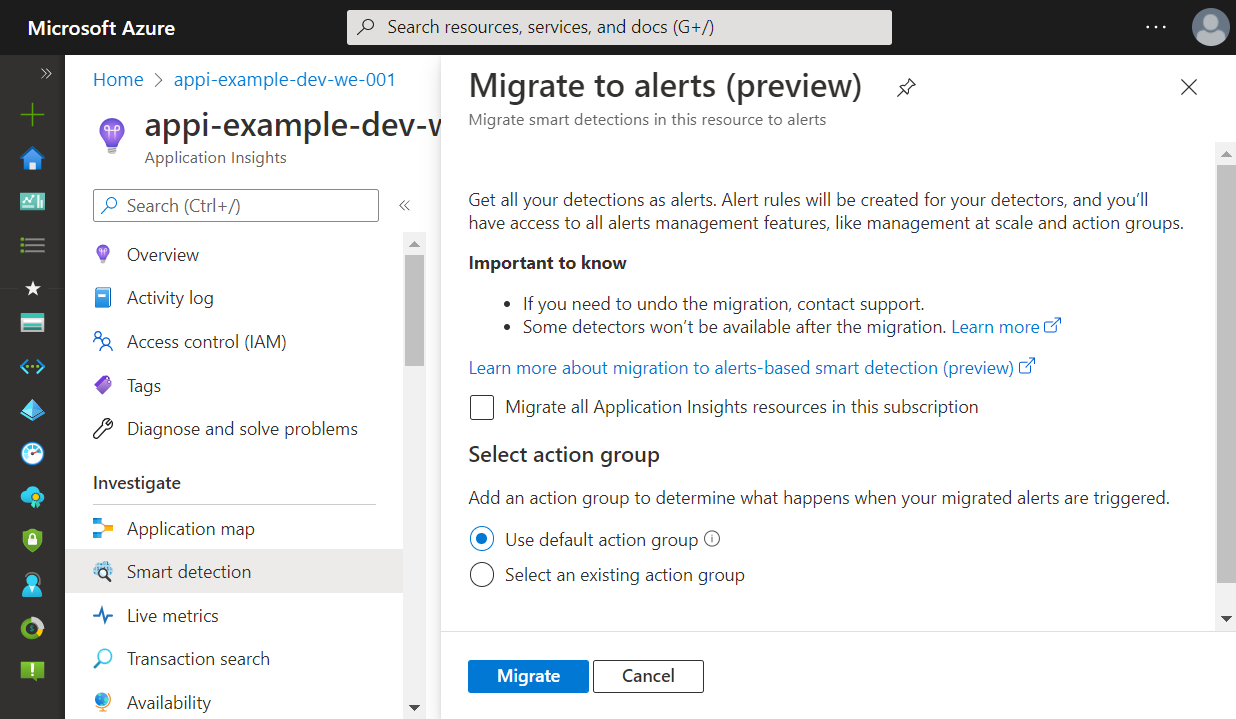
But since we want an automated deployment we have to search for a different way. azurerm does not support the deployment of ProactiveDetectionConfigs. That's why we use the azapi provider that allows automated deployment of resources not covered by azurerm.
The following block uses azapi_update_resource to add or modify the migrationToAlertRulesCompleted resource.
resource "azapi_update_resource" "application_insights_migrate_to_alerts" {
  type      = "Microsoft.Insights/components/ProactiveDetectionConfigs@2018-05-01-preview"
  name      = "migrationToAlertRulesCompleted"
  parent_id = azurerm_application_insights.example.id

  body = jsonencode({
    properties = {
      Name                           = "migrationToAlertRulesCompleted"
      SendEmailsToSubscriptionOwners = false
      Enabled                        = true
      CustomEmails                   = []
    }
  })

  depends_on = [
    azurerm_monitor_smart_detector_alert_rule.request_performance_degradation_detector
  ]
}
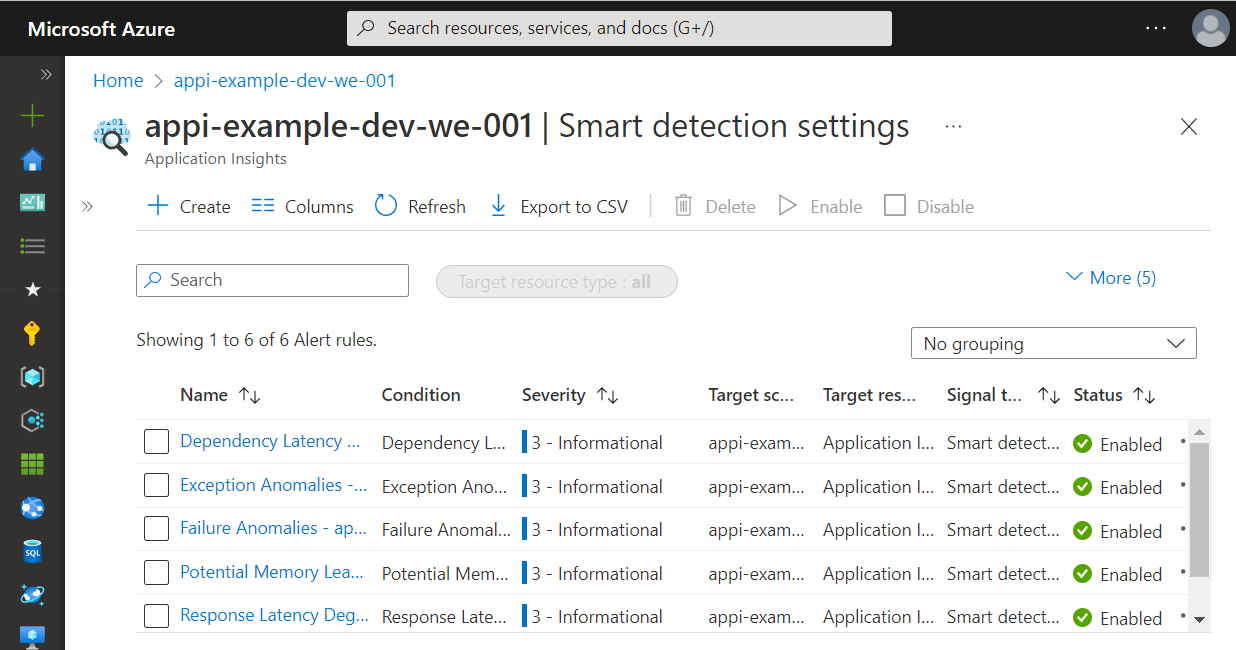
With migrationToAlertRulesCompleted resource enabled Application Insight now knows about the Smart Detection within Azure Monitor. Instead of displaying the internal Smart Detection mechanism the settings blade within Application Insights now shows the new Azure Monitor alert rules.
Special Case: "Failure Anomalies"
The smart detector FailureAnomaliesDetector is created by Azure when creating a new Application Insights instance. During this creation process, a default action group is applied to the rule. With this group all identities assigned to the subscription with the roles "Monitoring Contributor" and "Monitoring Reader" are notified when an alert occurs. At the moment there is no way to prevent or modify this behavior. But Terraform and the azapi provider for the rescue.
Since azurerm provider release 3.0.0 Terraform can disable the alert rule using the disable_generated_rule flag.
provider "azurerm" {
  features {
    application_insights {
      disable_generated_rule = true
    }
  }
}
With this flag set the alert rule 'Failure Anomalies' is still created using the default action group. However, the rule is disabled by default.
But if we want to use the smart detector this is not the right approach. Instead, we need to adjust the rule within our automated Terraform deployment. Since we cannot create the rule (because it's created with Application Insights implicitly) we can either import it to the Terraform state or adjust the rule by again using the azapi Terraform provider.
The next code block can be used to modify the failure anomalies rule. In this example, the action group is mapped to our previously created group and the rule is enabled.
resource "azapi_update_resource" "failure_anomalies_detector" {
  type      = "Microsoft.AlertsManagement/SmartDetectorAlertRules@2021-04-01"
  name      = "Failure Anomalies - ${azurerm_application_insights.example.name}"
  parent_id = azurerm_resource_group.example.id

  body = jsonencode({
    properties = {
      state: "Enabled",
      actionGroups = {
        groupIds = [
          azurerm_monitor_action_group.example.id
        ]
      }
    }
  })

  depends_on = [
    azurerm_application_insights.default
  ]
}
Wrapping up
In this article, I've explained to you how to create a Terraform deployment for Application Insights. Using the new alert-based Smart Detection feature alerts can now be configured as needed and the right persons can be notified using action groups. Since not all of the required functions are available within the azurerm Terraform provider we have also used the azapi provider that enables the use of features that are not covered by the azurerm provider yet. As a result, we can create and configure Application Insights using a fully automated deployment as infrastructure as code.
Thank you for taking the time to read my article. 😄
If you enjoyed it and want to see more coding-related content then follow me on my social profiles. Don't hesitate to like, comment or share this post. I appreciate any kind of feedback on this article.


